See your weekly revenue broken down by service every Monday
Every Monday, WebRun opens Mangomint, pulls last week's completed appointment and retail revenue, organizes it by service category and provider, logs the breakdown to Google Sheets for trend tracking, and posts a concise summary to your management Slack channel.
- No credit card
- Under $0.01 per run
- Cancel anytime
How do I automatically get a weekly revenue breakdown by service for my med spa?
WebRun pulls last week's completed appointments and retail sales from Mangomint every Monday, breaks revenue down by service category and provider, logs the data to Google Sheets, and posts a summary to your management Slack channel. No client data leaves the system; only aggregated revenue figures are shared.
- Management sees a complete revenue breakdown by service category before the week's first appointment
- Week-over-week trends are tracked automatically so underperforming categories are spotted early
- All data is logged to Google Sheets for month and quarter trend analysis without any manual entry
Built for med spa owners and managers · aesthetic clinic directors · multi-provider cosmetic practices · medspa operations teams
What does WebRun do on every run?
The exact actions WebRun takes, in order - in plain language, so you can adjust anything.
-
WebRun signs in and gets to work
Opens
app.mangomint.comin a real browser with your saved login - no setup, no API keys. -
1
Mangomint - pull last week's completed revenue
mangomint.com How to Automate Mangomint
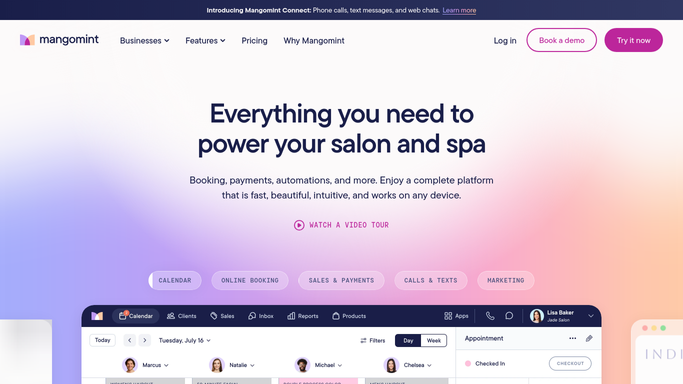
WebRun opens Mangomint to pull last week's completed revenue. - Open Mangomint and filter completed appointments and retail sales from the past 7 days
- Break total revenue into service categories such as injectables, laser, facials, body treatments, memberships, and retail
- Also break revenue by provider to show individual contribution
- Calculate week-over-week change for each category if prior-week data is available
Done when Last week's revenue is fully broken down by service category and provider.
-
2
Google Sheets - log the revenue breakdown for trend tracking
google.com How to Automate Google Sheets

WebRun opens Google Sheets to log the revenue breakdown for trend tracking. - Open the weekly revenue tracking sheet and append last week's row with the full category breakdown
- Update running totals for the current month and quarter
- Flag any category that declined more than 15 percent week-over-week
Done when Last week's revenue data is logged in Google Sheets with month-to-date and quarter-to-date totals updated.
-
3
Slack - post the weekly revenue summary to management
slack.com How to Automate Slack

WebRun opens Slack to post the weekly revenue summary to management. - Post the weekly revenue summary to the management or owner Slack channel
- Include total revenue, top-performing service category, and top-performing provider
- Flag any categories with a significant week-over-week decline and note the Google Sheets link for full detail
Done when Management has the weekly revenue summary in Slack with a link to the full breakdown.
How is each run configured?
Secure by default
Connect once, stays signed in
WebRun signs in once and keeps each session in a persistent environment, so every run picks up right where it left off.
Every action is checked against this policy before it runs.
Questions, answered
Does this report share any client data externally?
No. The weekly revenue report contains only aggregated financial figures by service category and provider. No individual client names, contact details, or treatment records are included.
Can it compare this week's revenue to the same week last year?
WebRun calculates week-over-week change using the previous week logged in Google Sheets. Year-over-year comparison can be added once enough historical data is accumulated in the sheet.
What counts as a service category?
WebRun groups revenue using the service categories defined in your Mangomint setup, such as injectables, laser, facials, body treatments, memberships, and retail. Your team can customize these groupings during setup.
Related templates
Put this on autopilot.
Turn it on in minutes - or have our team set it up for you.