Get a weekly Plausible traffic scorecard
Every Monday, WebRun opens Plausible, reads last week's visitors, top referral sources, and goal conversions, logs the numbers to an Airtable tracker, and writes a short scorecard into Notion so the team sees the trend without opening the dashboard.
- No credit card
- Under $0.01 per run
- Cancel anytime
How do I get a weekly Plausible Analytics traffic report?
WebRun reads your Plausible dashboard every Monday, pulls last week's visitors, top referral sources, and goal conversions, logs them to an Airtable tracker, and writes a short scorecard in Notion with the week over week change. Marketing and product teams get a standing traffic trend without opening the dashboard themselves.
- A standing traffic trend lands in Notion every Monday
- Week over week change is always shown, not just raw totals
- Months of history build up in Airtable automatically
Built for marketing teams · founders · content teams
What does WebRun do on every run?
The exact actions WebRun takes, in order - in plain language, so you can adjust anything.
-
WebRun signs in and gets to work
Opens
plausible.ioin a real browser with your saved login - no setup, no API keys. -
1
Plausible Analytics - read last week's traffic
plausible.io

WebRun opens Plausible Analytics to read last week's traffic. - Open the Plausible dashboard for the tracked site
- Read total visitors, top sources, and goal conversions for the last 7 days
- Compare each number against the prior week
Done when Last week's key numbers are read and compared to the week before.
-
2
Airtable - log the numbers
airtable.com How to Automate Airtable

WebRun opens Airtable to log the numbers. - Open the traffic tracker base in Airtable
- Add a new row with this week's visitors, top source, and conversions
- Keep the week over week history in one table
Done when This week's numbers are a new row in the Airtable tracker.
-
3
Notion - deliver the scorecard
notion.so How to Automate Notion
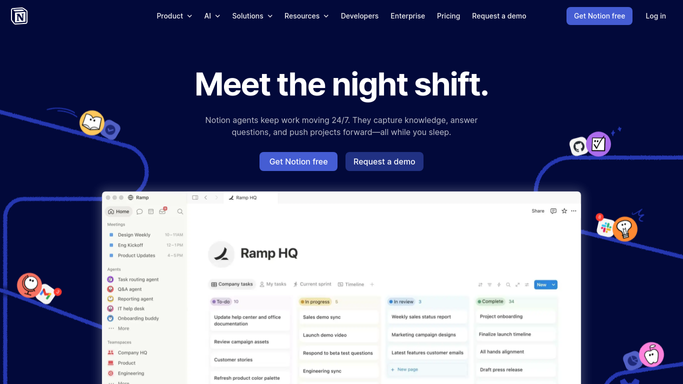
WebRun opens Notion to deliver the scorecard. - Open the weekly scorecard page in Notion
- Write a short summary of visitors, top source, and goal conversions with the week over week change
- Link back to the Airtable row for the full history
Done when This week's scorecard is published in Notion.
How is each run configured?
Secure by default
Connect once, stays signed in
WebRun signs in once and keeps each session in a persistent environment, so every run picks up right where it left off.
Every action is checked against this policy before it runs.
Questions, answered
Does WebRun need access to visitor level data?
No. It only reads the aggregate numbers Plausible already shows on the dashboard, the same privacy friendly totals you see yourself.
Where does the history live?
In the Airtable tracker. Every week adds one row, so you can chart the trend over months without exporting anything by hand.
What if traffic drops sharply one week?
It still gets reported plainly with the week over week change shown, so a drop is visible in the scorecard rather than buried.
Related templates
Put this on autopilot.
Turn it on in minutes - or have our team set it up for you.